CalculatePi1
Last updated: 2022-06-24
Checks: 6 1
Knit directory: ChromatinSplicingQTLs/analysis/
This reproducible R Markdown analysis was created with workflowr (version 1.6.2). The Checks tab describes the reproducibility checks that were applied when the results were created. The Past versions tab lists the development history.
The R Markdown is untracked by Git. To know which version of the R Markdown file created these results, you’ll want to first commit it to the Git repo. If you’re still working on the analysis, you can ignore this warning. When you’re finished, you can run wflow_publish to commit the R Markdown file and build the HTML.
Great job! The global environment was empty. Objects defined in the global environment can affect the analysis in your R Markdown file in unknown ways. For reproduciblity it’s best to always run the code in an empty environment.
The command set.seed(20191126) was run prior to running the code in the R Markdown file. Setting a seed ensures that any results that rely on randomness, e.g. subsampling or permutations, are reproducible.
Great job! Recording the operating system, R version, and package versions is critical for reproducibility.
Nice! There were no cached chunks for this analysis, so you can be confident that you successfully produced the results during this run.
Great job! Using relative paths to the files within your workflowr project makes it easier to run your code on other machines.
Great! You are using Git for version control. Tracking code development and connecting the code version to the results is critical for reproducibility.
The results in this page were generated with repository version 2ca3bcb. See the Past versions tab to see a history of the changes made to the R Markdown and HTML files.
Note that you need to be careful to ensure that all relevant files for the analysis have been committed to Git prior to generating the results (you can use wflow_publish or wflow_git_commit). workflowr only checks the R Markdown file, but you know if there are other scripts or data files that it depends on. Below is the status of the Git repository when the results were generated:
Ignored files:
    Ignored:    .DS_Store
    Ignored:    .Rhistory
    Ignored:    .Rproj.user/
    Ignored:    analysis/.Rhistory
    Ignored:    code/.DS_Store
    Ignored:    code/.RData
    Ignored:    code/._.DS_Store
    Ignored:    code/._README.md
    Ignored:    code/._report.html
    Ignored:    code/.ipynb_checkpoints/
    Ignored:    code/.snakemake/
    Ignored:    code/Alignments/
    Ignored:    code/ENCODE/
    Ignored:    code/ExpressionAnalysis/
    Ignored:    code/FastqFastp/
    Ignored:    code/FastqFastpSE/
    Ignored:    code/Genotypes/
    Ignored:    code/IntronSlopes/
    Ignored:    code/Misc/
    Ignored:    code/MiscCountTables/
    Ignored:    code/Multiqc/
    Ignored:    code/Multiqc_chRNA/
    Ignored:    code/PeakCalling/
    Ignored:    code/Phenotypes/
    Ignored:    code/PlotGruberQTLs/
    Ignored:    code/PlotQTLs/
    Ignored:    code/ProCapAnalysis/
    Ignored:    code/QC/
    Ignored:    code/QTLs/
    Ignored:    code/ReferenceGenome/
    Ignored:    code/Rplots.pdf
    Ignored:    code/Session.vim
    Ignored:    code/SplicingAnalysis/
    Ignored:    code/TODO
    Ignored:    code/Tehranchi/
    Ignored:    code/bigwigs/
    Ignored:    code/bigwigs_FromNonWASPFilteredReads/
    Ignored:    code/config/.DS_Store
    Ignored:    code/config/._.DS_Store
    Ignored:    code/config/.ipynb_checkpoints/
    Ignored:    code/debug.ipynb
    Ignored:    code/debug_python.ipynb
    Ignored:    code/deepTools/
    Ignored:    code/featureCounts/
    Ignored:    code/gwas_summary_stats/
    Ignored:    code/hyprcoloc/
    Ignored:    code/igv_session.xml
    Ignored:    code/log
    Ignored:    code/logs/
    Ignored:    code/notebooks/.ipynb_checkpoints/
    Ignored:    code/rules/.ipynb_checkpoints/
    Ignored:    code/rules/OldRules/
    Ignored:    code/rules/notebooks/
    Ignored:    code/scratch/
    Ignored:    code/scripts/.CalculatePi1_GetAscertainmentP.py.swp
    Ignored:    code/scripts/.ipynb_checkpoints/
    Ignored:    code/scripts/GTFtools_0.8.0/
    Ignored:    code/scripts/__pycache__/
    Ignored:    code/scripts/liftOverBedpe/liftOverBedpe.py
    Ignored:    code/snakemake.log
    Ignored:    code/snakemake.sbatch.log
    Ignored:    data/.DS_Store
    Ignored:    data/._.DS_Store
    Ignored:    data/._20220414203249_JASPAR2022_combined_matrices_25818_jaspar.txt
    Ignored:    data/GWAS_catalog_summary_stats_sources/._list_gwas_summary_statistics_6_Apr_2022-10.csv
    Ignored:    data/GWAS_catalog_summary_stats_sources/._list_gwas_summary_statistics_6_Apr_2022-11.csv
    Ignored:    data/GWAS_catalog_summary_stats_sources/._list_gwas_summary_statistics_6_Apr_2022-2.csv
    Ignored:    data/GWAS_catalog_summary_stats_sources/._list_gwas_summary_statistics_6_Apr_2022-3.csv
    Ignored:    data/GWAS_catalog_summary_stats_sources/._list_gwas_summary_statistics_6_Apr_2022-4.csv
    Ignored:    data/GWAS_catalog_summary_stats_sources/._list_gwas_summary_statistics_6_Apr_2022-5.csv
    Ignored:    data/GWAS_catalog_summary_stats_sources/._list_gwas_summary_statistics_6_Apr_2022-6.csv
    Ignored:    data/GWAS_catalog_summary_stats_sources/._list_gwas_summary_statistics_6_Apr_2022-7.csv
    Ignored:    data/GWAS_catalog_summary_stats_sources/._list_gwas_summary_statistics_6_Apr_2022-8.csv
    Ignored:    data/GWAS_catalog_summary_stats_sources/._list_gwas_summary_statistics_6_Apr_2022.csv

Untracked files:
    Untracked:  analysis/20220622_QuantifyColocRateMoreInterpretableWay.Rmd
    Untracked:  analysis/20220623_CalculatePi1.Rmd
    Untracked:  code/scripts/CalculateLD_PerGeneWindow.py
    Untracked:  code/scripts/CalculateLD_PerGeneWindow_Chunks.py
    Untracked:  code/scripts/CalculatePi1_GetAscertainmentP.py
    Untracked:  code/scripts/CalculatePi1_GetTraitPairs.R
    Untracked:  code/scripts/PlotColocFromHyprcolocResults.R
    Untracked:  code/snakemake_profiles/slurm/__pycache__/
    Untracked:  data/Phenotypes_recode_for_Plotting.txt

Unstaged changes:
    Modified:   analysis/20220606_PlotColocsForIntuitions.Rmd
    Modified:   code/Snakefile
    Modified:   code/rules/Coloc.smk
    Modified:   code/rules/MakeBigwigs.smk
    Modified:   code/scripts/GenometracksByGenotype
    Modified:   code/scripts/hyprcoloc_genewise2.R
    Modified:   data/ColorsForPhenotypes.xlsx
Note that any generated files, e.g. HTML, png, CSS, etc., are not included in this status report because it is ok for generated content to have uncommitted changes.
There are no past versions. Publish this analysis with wflow_publish() to start tracking its development.
Introduction
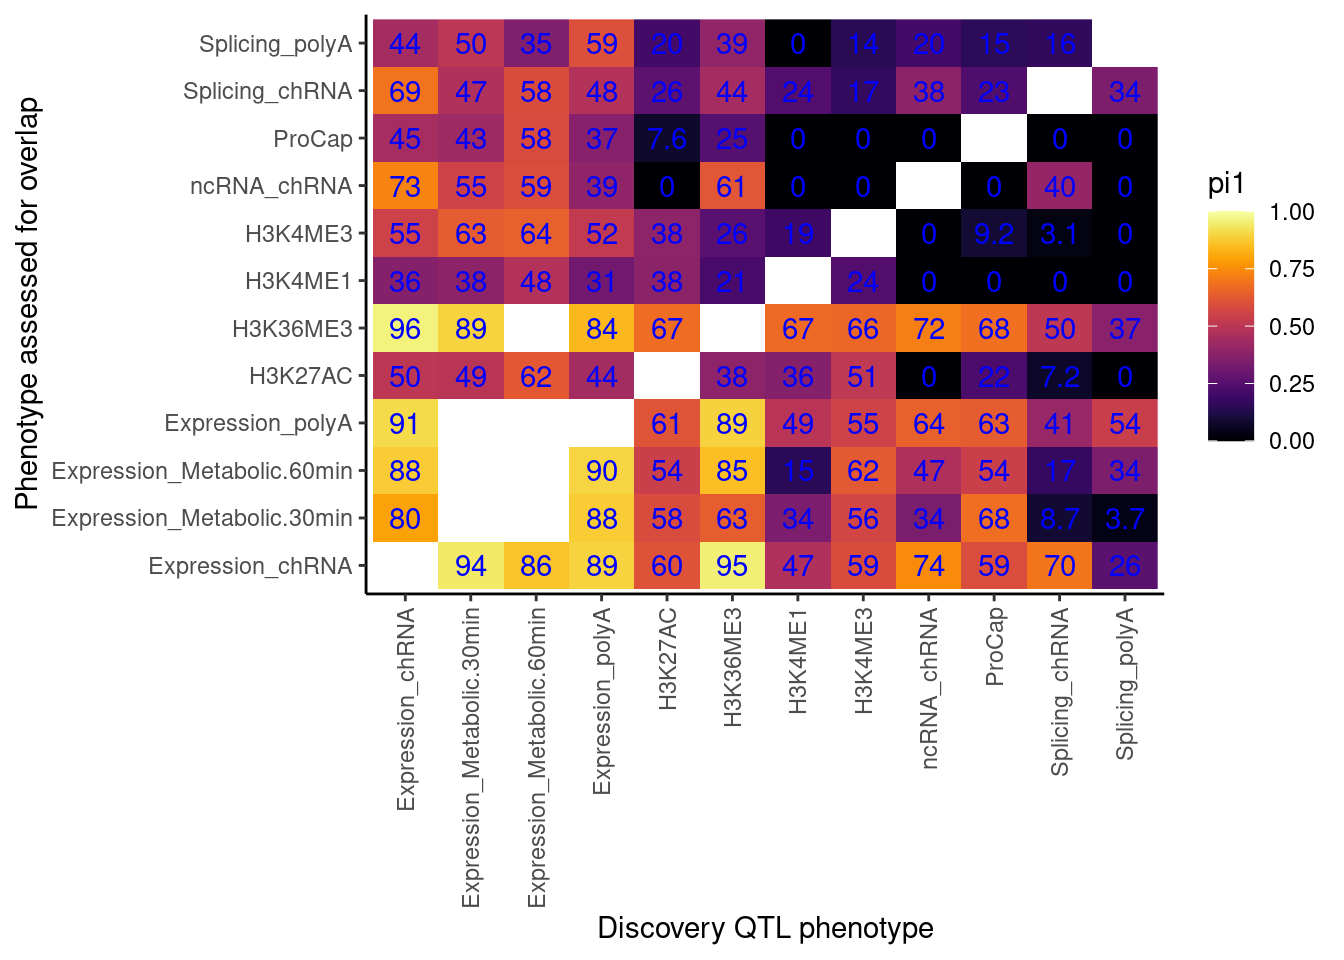
I have been making a lot of plots of heatmaps to summarise colocalization rate between different types of QTLs. Here I will make some analogous plots with the pi1 statistic. I already made a file that take all pairs of traits that i attempted to coloc, and collects the P value of trait2 (trait.y) for the top snp in trait.x. I will use
── Attaching packages ────────────────────────────────── tidyverse 1.3.0 ──✓ ggplot2 3.3.5 ✓ purrr 0.3.4
✓ tibble 2.1.3 ✓ dplyr 0.8.3
✓ tidyr 1.1.0 ✓ stringr 1.4.0
✓ readr 1.3.1 ✓ forcats 0.4.0── Conflicts ───────────────────────────────────── tidyverse_conflicts() ──
x dplyr::filter() masks stats::filter()
x dplyr::lag() masks stats::lag()
Attaching package: 'gplots'The following object is masked from 'package:stats':
lowessLoading required package: viridisLite
Attaching package: 'data.table'The following objects are masked from 'package:dplyr':
between, first, lastThe following object is masked from 'package:purrr':
transposeRead in data
Registered S3 method overwritten by 'R.oo':
  method        from
  throw.default R.methodsS3
Parsed with column specification:
cols(
PC = col_character(),
Alias = col_character(),
ShorterAlias = col_character(),
Include = col_logical()
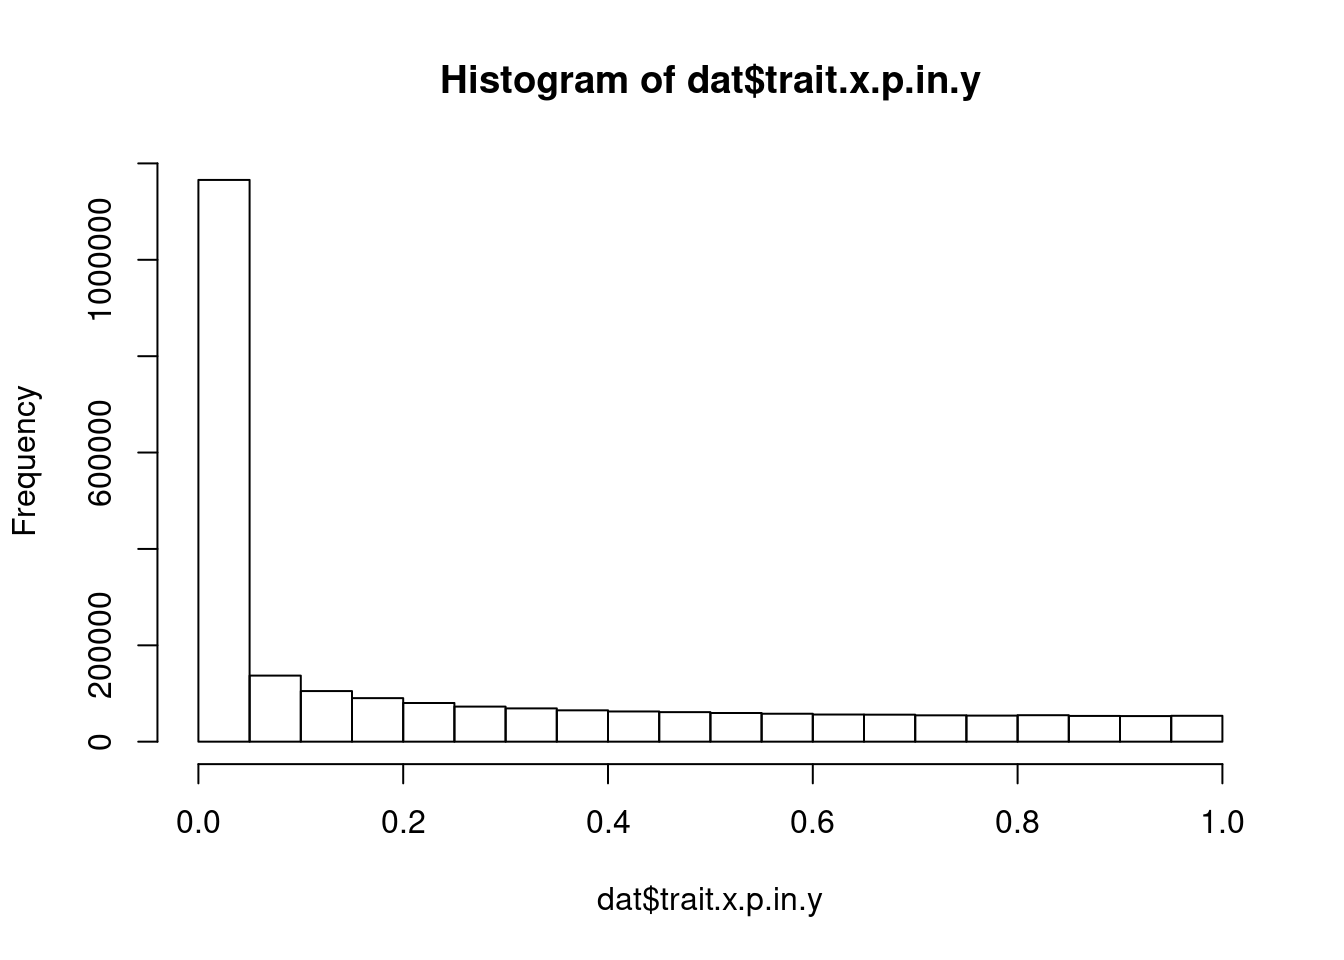
)First some sanity checks:
what is the distribution of p values in phenotype.y, for top snps for phenotype.x
…and what for colocalized trait pairs versus non colocalied trait pairs:
`stat_bin()` using `bins = 30`. Pick better value with `binwidth`.Warning: Removed 153616 rows containing non-finite values (stat_bin).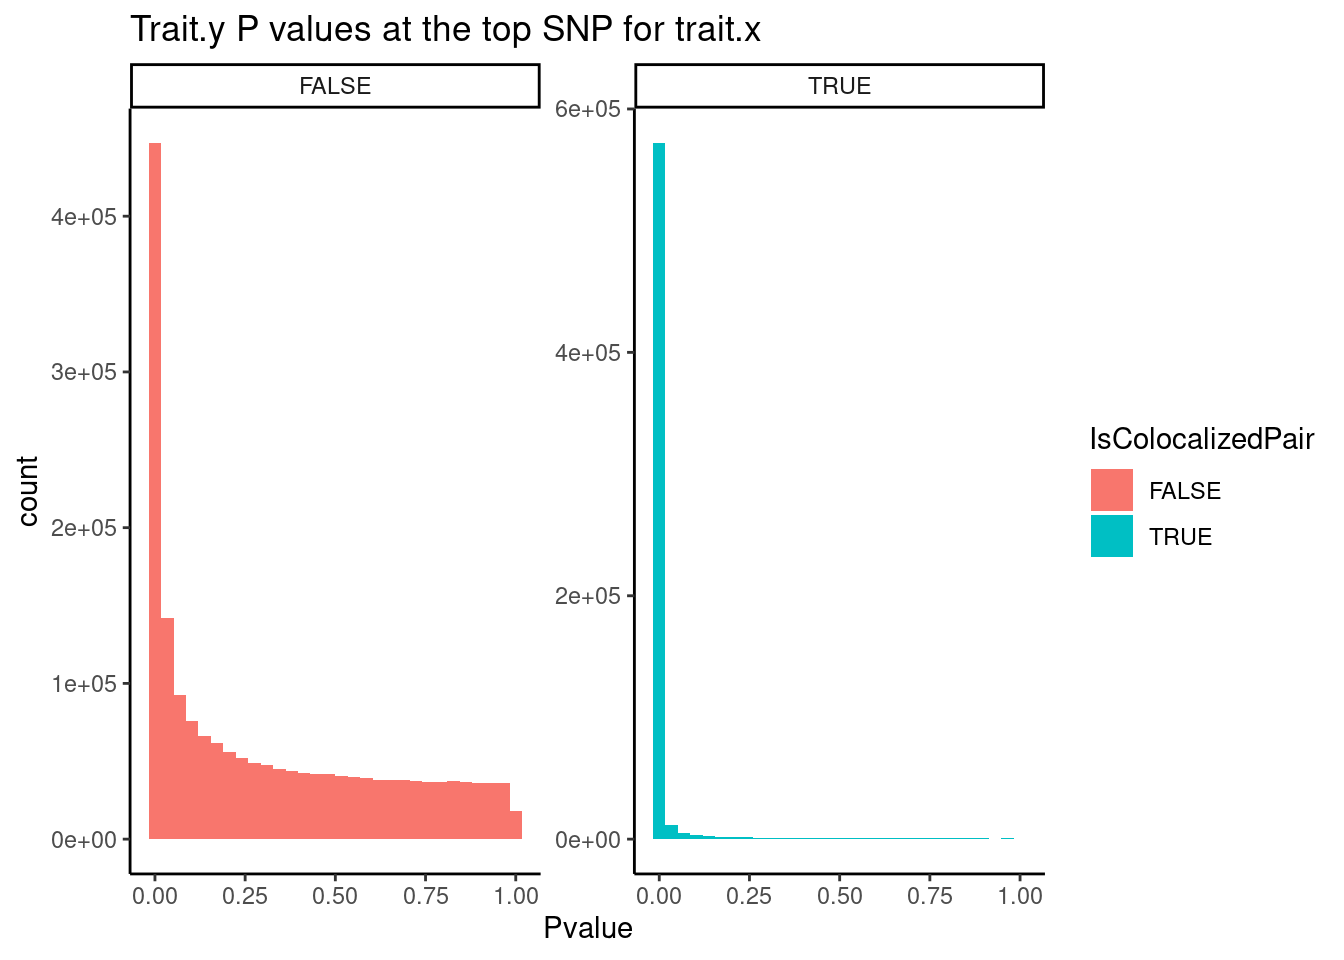
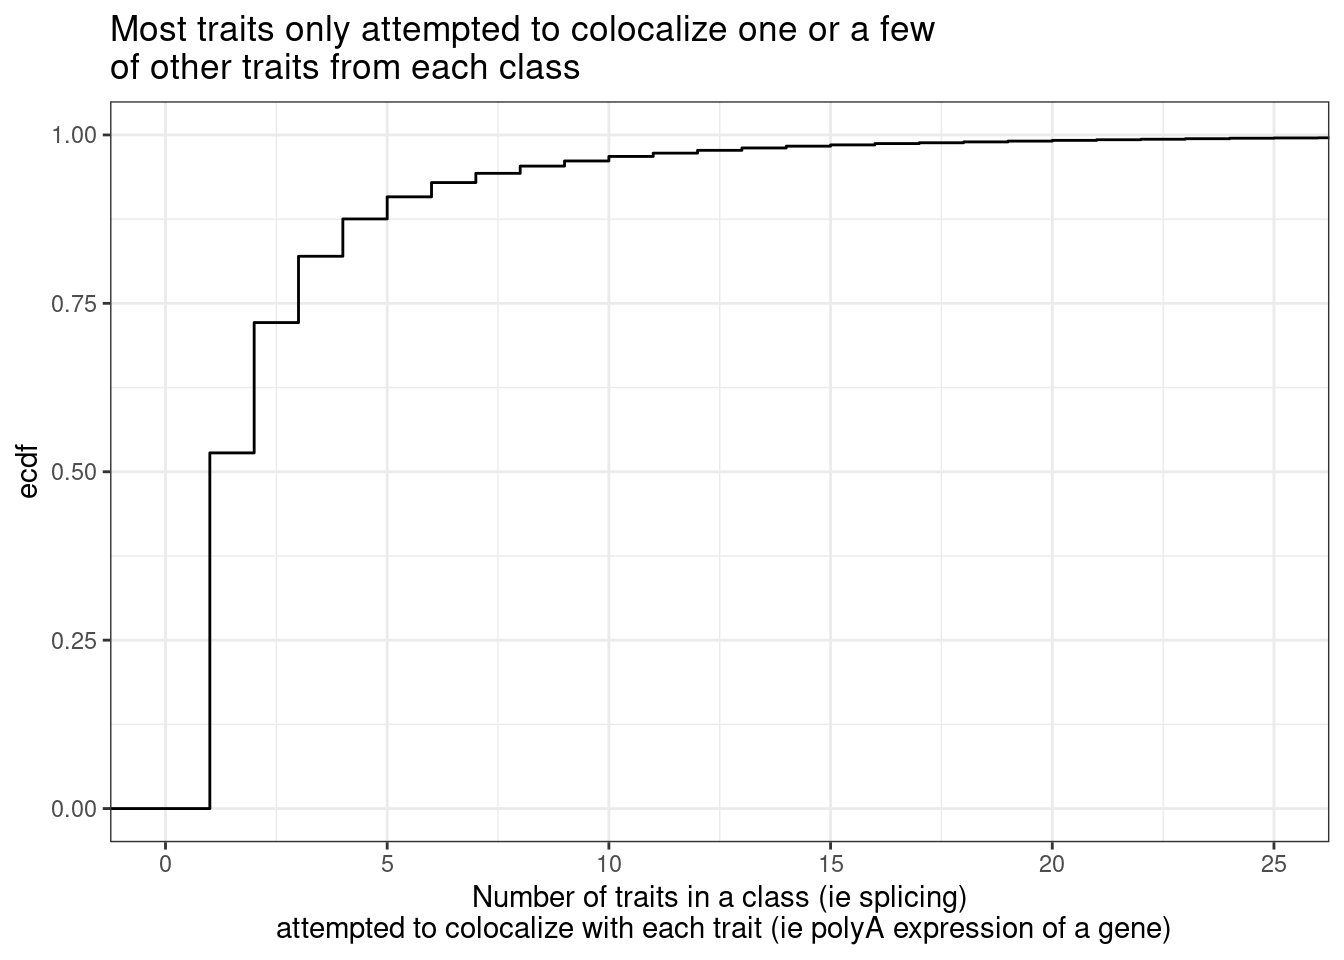
Now about the one phenotype to many problem… first let’s see the distribution of the number of phenotype y’s compared to each phenotype x.
Cactch errors and create pi1 heatmap without accounting for the one to many phenotypes problem…
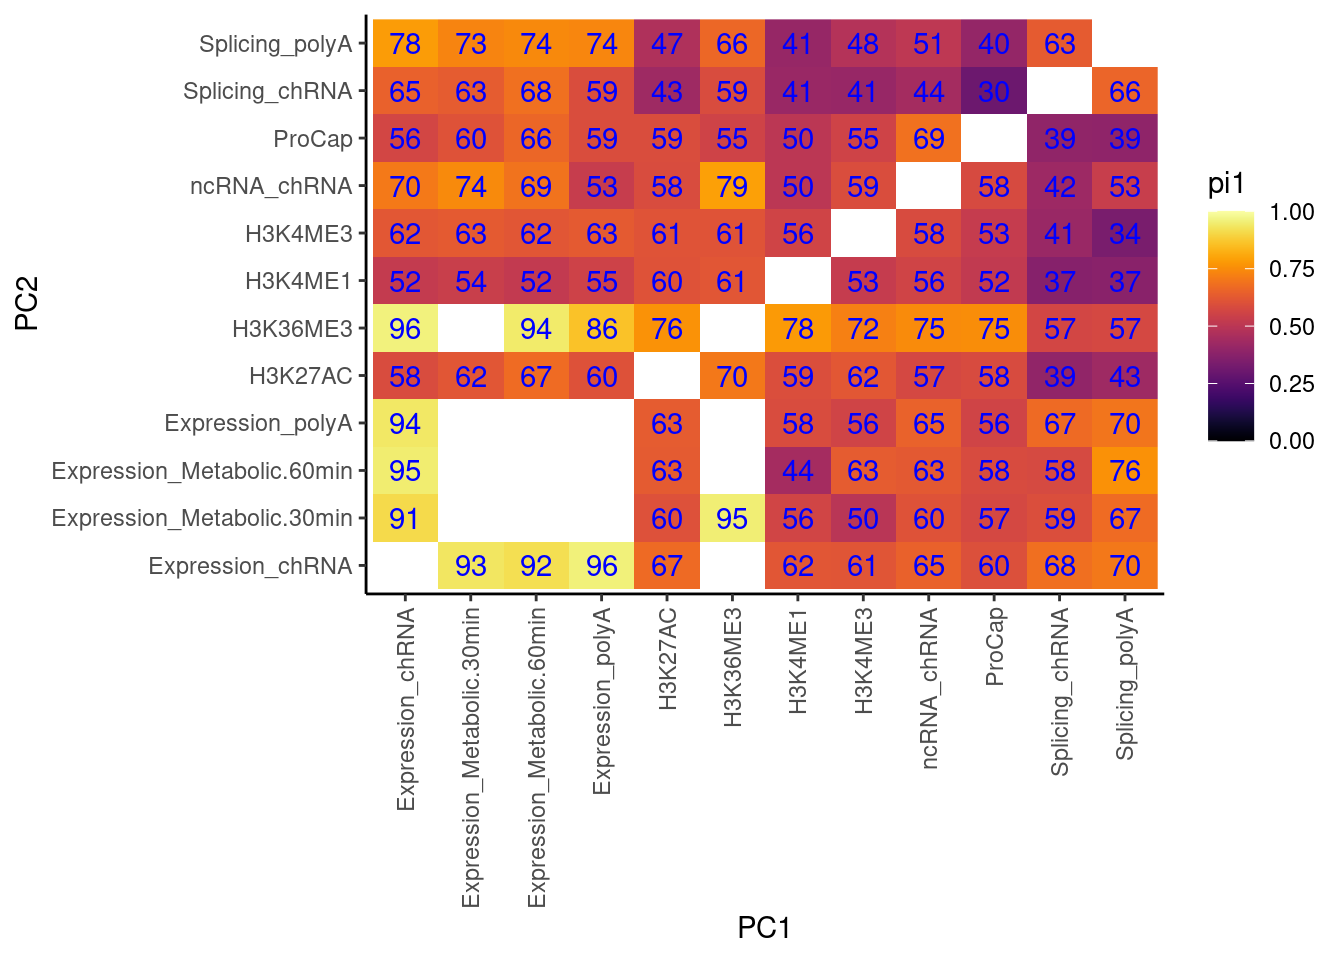
now accounting for that problem…
Now use that approach to catch errors with qvalue, while accounting for the one to many phenotypes problem.
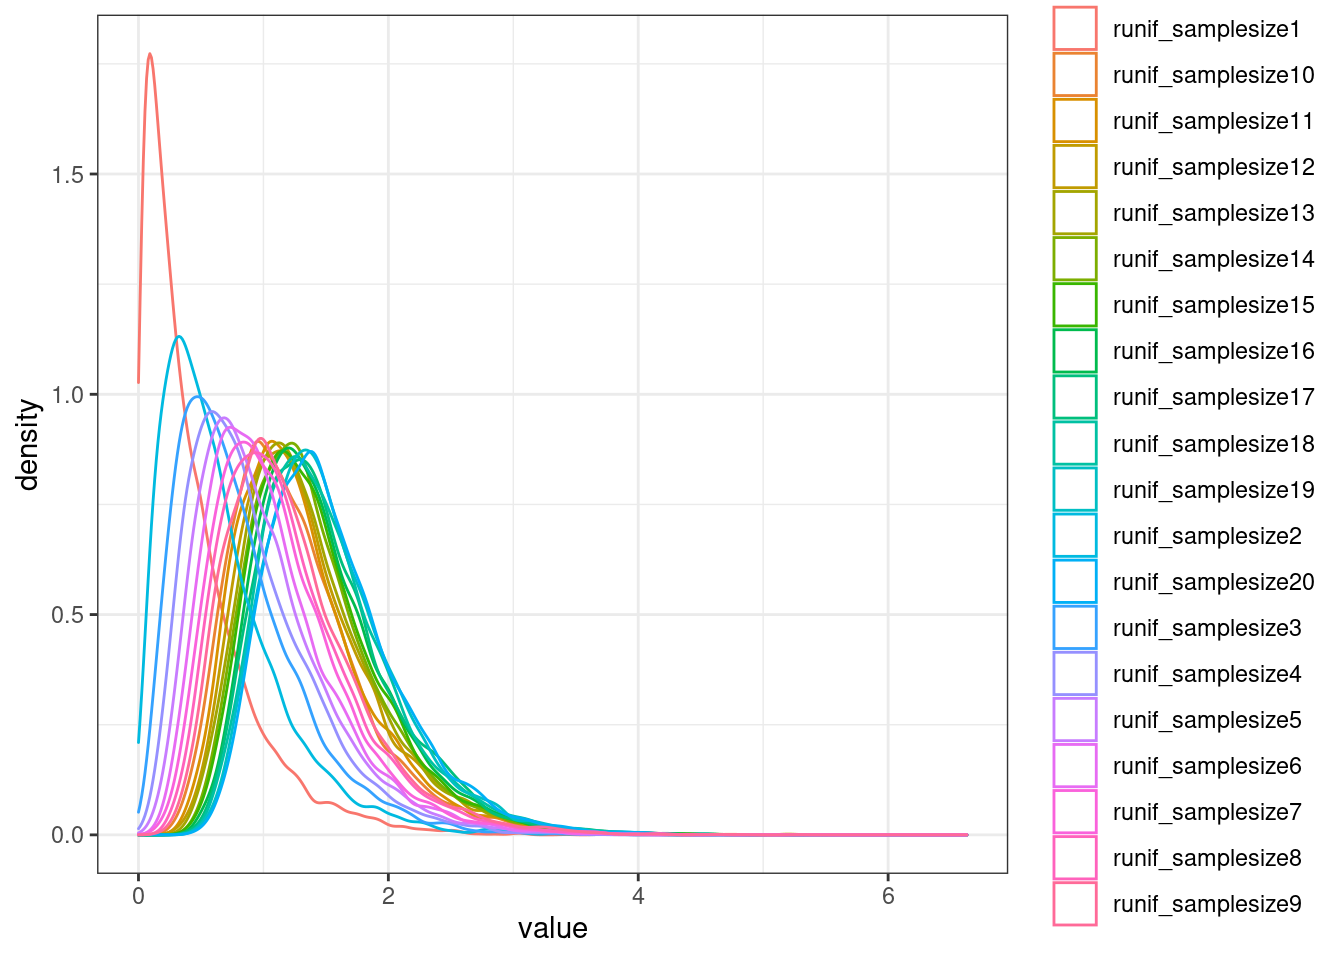
I think the above heatmaps are questionable because the size of the empirical null distribution is really small in most cases (ie 1 or 2), and I’m not sure how well empPvals behaves or introduces bias with this small null distribution. I think I will pre-calculate the null distribution for all samples sizes less than say 100.
`stat_bin()` using `bins = 30`. Pick better value with `binwidth`.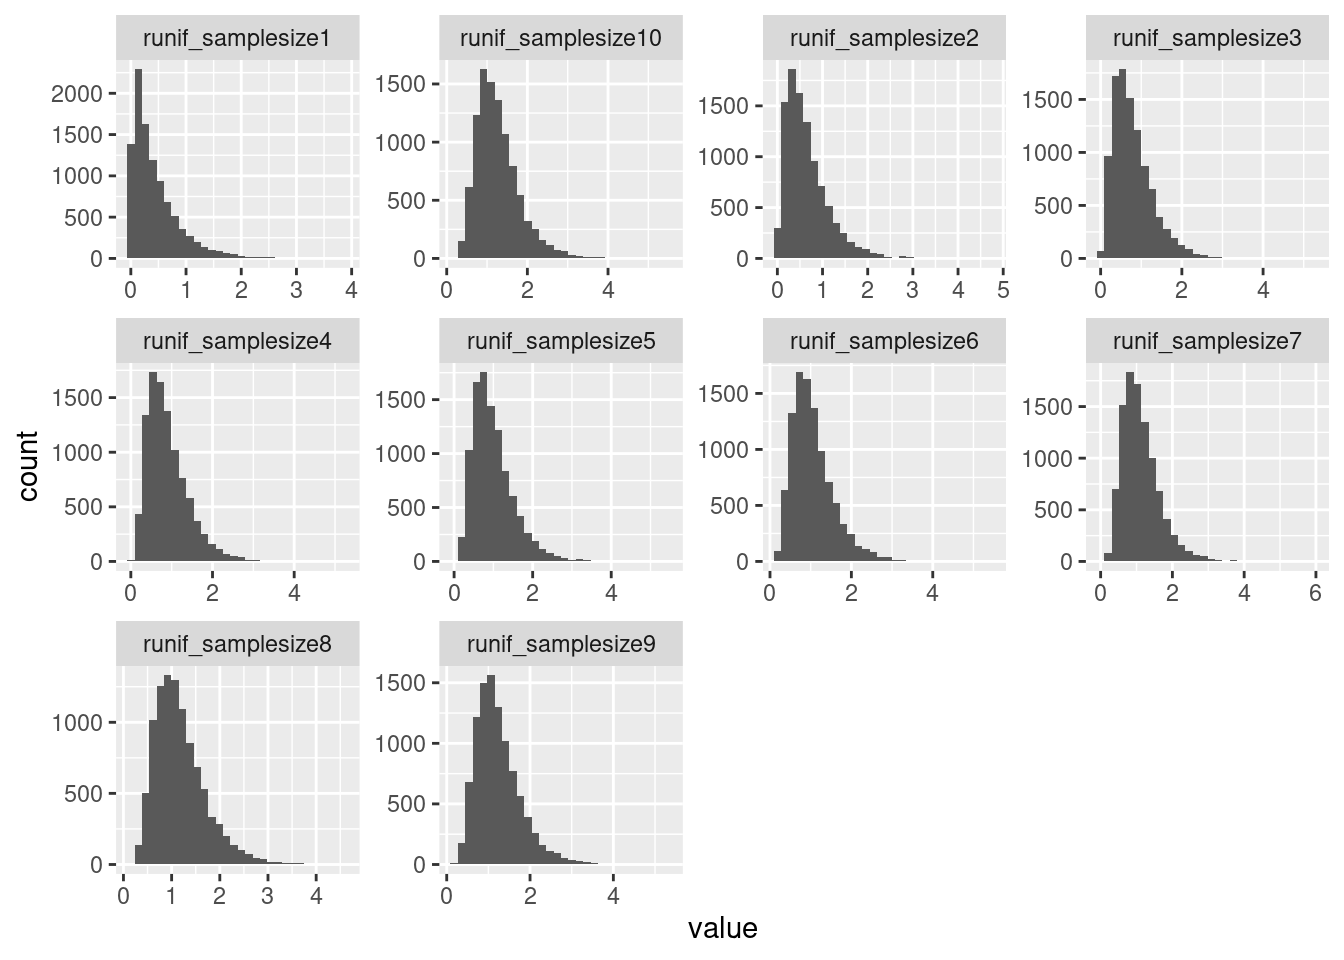
Now let’s remake the heatmaps
ooops i realized now that all this doesn’t make sense since i am only calculating pi1 from trait pairs i attempted to colocalize, meaning they are definitely a QTL for something even in the Trait.y, which will upwardly bias pi1.
Will have to redo a lot of these analyses considering all test traits
R version 3.6.1 (2019-07-05)
Platform: x86_64-pc-linux-gnu (64-bit)
Running under: Scientific Linux 7.4 (Nitrogen)

Matrix products: default
BLAS/LAPACK: /software/openblas-0.2.19-el7-x86_64/lib/libopenblas_haswellp-r0.2.19.so

locale:
 [1] LC_CTYPE=en_US.UTF-8       LC_NUMERIC=C
 [3] LC_TIME=en_US.UTF-8        LC_COLLATE=en_US.UTF-8
 [5] LC_MONETARY=en_US.UTF-8    LC_MESSAGES=en_US.UTF-8
 [7] LC_PAPER=en_US.UTF-8       LC_NAME=C
 [9] LC_ADDRESS=C               LC_TELEPHONE=C
[11] LC_MEASUREMENT=en_US.UTF-8 LC_IDENTIFICATION=C

attached base packages:
[1] stats     graphics  grDevices utils     datasets  methods   base

other attached packages:
 [1] data.table_1.14.2 viridis_0.5.1     viridisLite_0.3.0
 [4] gplots_3.0.1.1    qvalue_2.16.0     forcats_0.4.0
 [7] stringr_1.4.0     dplyr_0.8.3       purrr_0.3.4
[10] readr_1.3.1       tidyr_1.1.0       tibble_2.1.3
[13] ggplot2_3.3.5     tidyverse_1.3.0

loaded via a namespace (and not attached):
 [1] httr_1.4.1         jsonlite_1.6       splines_3.6.1
 [4] R.utils_2.9.0      modelr_0.1.8       gtools_3.8.1
 [7] assertthat_0.2.1   cellranger_1.1.0   yaml_2.2.0
[10] pillar_1.4.2       backports_1.1.4    lattice_0.20-38
[13] glue_1.3.1         digest_0.6.20      promises_1.0.1
[16] rvest_0.3.5        colorspace_1.4-1   htmltools_0.3.6
[19] httpuv_1.5.1       R.oo_1.22.0        plyr_1.8.4
[22] pkgconfig_2.0.2    broom_0.5.2        haven_2.3.1
[25] scales_1.1.0       gdata_2.18.0       later_0.8.0
[28] git2r_0.26.1       farver_2.1.0       generics_0.0.2
[31] ellipsis_0.2.0.1   withr_2.4.1        cli_2.2.0
[34] magrittr_1.5       crayon_1.3.4       readxl_1.3.1
[37] evaluate_0.14      R.methodsS3_1.7.1  fs_1.3.1
[40] fansi_0.4.0        nlme_3.1-140       xml2_1.3.2
[43] tools_3.6.1        hms_0.5.3          lifecycle_0.1.0
[46] munsell_0.5.0      reprex_0.3.0       compiler_3.6.1
[49] caTools_1.17.1.2   rlang_0.4.10       grid_3.6.1
[52] rstudioapi_0.10    labeling_0.3       bitops_1.0-6
[55] rmarkdown_1.13     gtable_0.3.0       DBI_1.1.0
[58] reshape2_1.4.3     R6_2.4.0           gridExtra_2.3
[61] lubridate_1.7.4    knitr_1.23         workflowr_1.6.2
[64] rprojroot_2.0.2    KernSmooth_2.23-15 stringi_1.4.3
[67] Rcpp_1.0.5         vctrs_0.3.1        dbplyr_1.4.2
[70] tidyselect_1.1.0   xfun_0.8